The first workshop on the use cases of Virtual Research Environments (VREs) in D4Science (the platform on which the ARIADNE Portal runs) was held on Thursday, 28th of January 2021. It was well attended with 52 participants joining the Zoom call. Two specific topics were covered – geospatial/GIS and mortuary archaeology data and research. After an introduction by Franco Niccolucci, the Project Co-ordinator, who outlined the next two years aims of the project in view of the current situation. This had highlighted the usefulness of digital data when archaeologists can’t have access to physical sites and objects. ARIADNEplus now has to meet these new challenges.
Guntram Geser, the Project Innovation Manager, then set the scene for the workshop. VREs are to be used for carrying out research tasks for which supporting services and tools are required. Archaeologists need to understand VREs and their possibilities in order to propose functional descriptions so that a VRE meets their specific needs. The purpose of the workshop was, therefore, to improve the participants understanding by presenting analyses performed by the two associated special interest groups on what they required (i.e. bottom-up) from a research context. In addition, Massimiliano Assante who manages a number of successful VREs on D4Science for other organisations, would demonstrate two very successful examples which highlighted the possibilities that VREs offer (top-down) and which make use of a number of existing D4Science services.
David Novák, who leads the geospatial/GIS group started his analysis pointing out that this is an unusual topic in that almost all archaeological data includes geographical data, i.e. GIS is the “reverse side of all the other coins”. Integration into ARIADNEplus was challenging due to the high heterogeneity of current GIS data. Three levels of integration (into the ARIADNE Portal) were identified:
- Per specific domain
- Pre-selected datasets (i.e. in standard formats)
- Full item-level integration (most ambitious).
The AO-CAT ontology met the GIS data needs. Looking at the required GIS services, the selection criteria should be based on day-to-day use, the most needed and existing standard solutions. Furthermore, the services should be interoperable, contextual, usable, consistent and comparable.
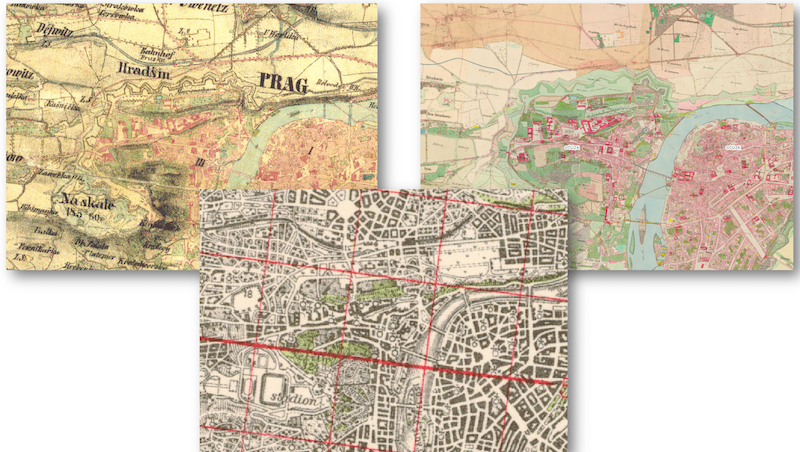
David illustrated the complexity of the GIS landscape by using examples from the Czech Republic which included maps of archaeological trenches, regional boundaries, monuments as well as raw datasets. Other examples included remote sensing data, ortho-photography, LIDAR visualisations as well as environmental maps featuring climate and topology. Furthermore, there are many services for different data types. He concluded that a survey of the partners would help identify the best solutions and that the presence of geodata services in the portal could lead to a greater understanding and use of other data in the Portal.
In the following discussion, it was suggested that contextual data could be stored in the Content Cloud with links to services that would help users understand the data. It was pointed out that unless the scale and resolution are recorded, the data is useless. INSPIRE metadata includes this information and is also standard. Also, which data is searchable and which data is passed to services? The next step was to identify relevant partners who had datasets (e.g. that included the INSPIRE metadata) that could be used for test cases that would help answer these questions.
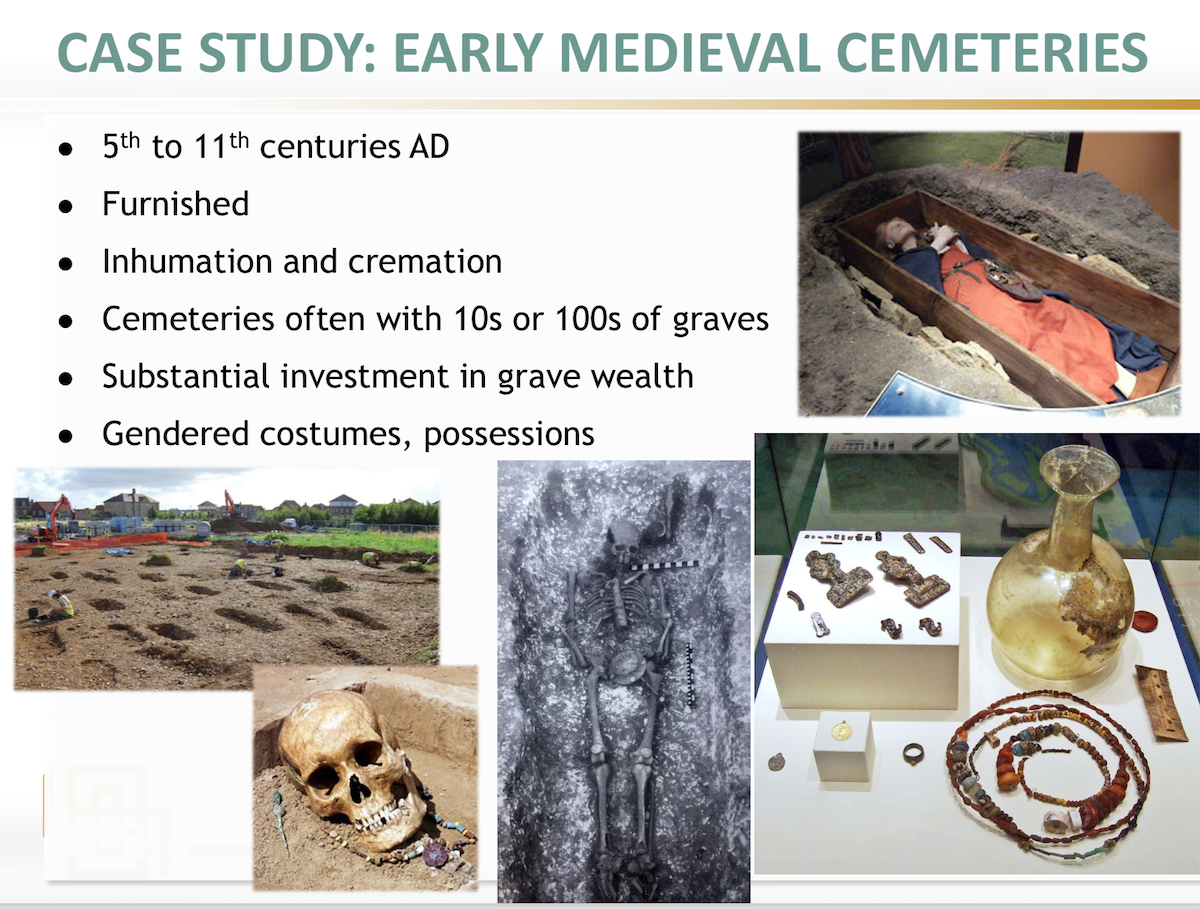
Next on the Agenda was the topic of Mortuary Data led by Edeltraud Aspöck who used the example of early medieval cemeteries for her analysis. She explained that this area of research had started with human remains and grown to include aspects such as the funerary processes and practices. This time period had been selected because mortuary data was the main source of information on the period between the 5th and 11th centuries with several datasets. Cemeteries contained between tens to hundreds of graves and data included costumes and possessions. Three types of datasets were identified:
- Documented study of the finds;
- Data resulting from post-excavation analysis;
- Datasets of, for example, mortuary practices in a region. This is of most interest at the item level.
Edeltraud then presented a typical data record which mainly follows the “What, Where, When” structure and details the grave and finds within the grave. Typical research questions ask who was buried, what was their funerary treatment? Other aspects relate to social structure and organisation such as status and family groups or affiliations. A specific example is Worthy Park Cemetery where the data included statistical analysis (significance testing), correspondence analysis/seriation (for dating) as well as mappings of the graves, originally drawn by hand and now increasingly created with GIS data.
In terms of a VRE wish list, some desired functions are as follows:
- Query different types of datasets (as mentioned above),
- Tools for basic and advanced analyses,
- Create links to other datasets (e.g. contextual data),
- Visualise results with charts and maps/GIS,
- Use Artificial Intelligence to auto-classify images (e.g. drawings showing grave disturbances),
- 3D models for annotation, ideally connected to a knowledge base.
Next, the THANADOS Project was presented which is turning ‘analogue’ catalogues of cemeteries and graves into digital research data. Like ARIADNEplus, THANADOS uses CIDOC-CRM and conforms to FAIR as well as other data standards. It was agreed that co-operation between the two projects should be pursued, especially as this would improve ARIADNE’s coverage in central Europe.
The discussion on mortuary data started with the quality of the data, especially in the case of recording age and gender which may not always be easy to determine (and can be uncertain). Anthropologists tend to collect this data and other indicators can be used such as gendered grave goods. Burial data is considered to be interesting due to the amount of GIS and scientific data it includes which will require a wide range of services and tools for research using a VRE.
The last part of the Workshop illustrated how VREs can be used and proved to be quite an eye-opener. Massimiliano Assante illustrated the benefits and potential through two success stories:
- Alien and Invasive Species
- The Protected Areas Impact Maps
Both VREs use the D4Science GIS services. In the first case, the Puffer fish (a highly toxic fish) which has colonised parts of the Mediterranean and caused serious problems for fishermen. The goal was to predict which areas the fish was likely to spread to next using data mining. In order to achieve this required scientists scattered across different organisations to collaborate, using heterogeneous datasets as well as access to large scale computing facilities for data mining running different algorithms quickly. All of this was possible through the VRE and the end result was a report* which provided the required information using the geospatial layers viewer and allowed access to the algorithms and data in the VRE Catalogue. Furthermore, the VRE conforms with standards and best practices – it is Open Science compliant and applies the FAIR data principles.
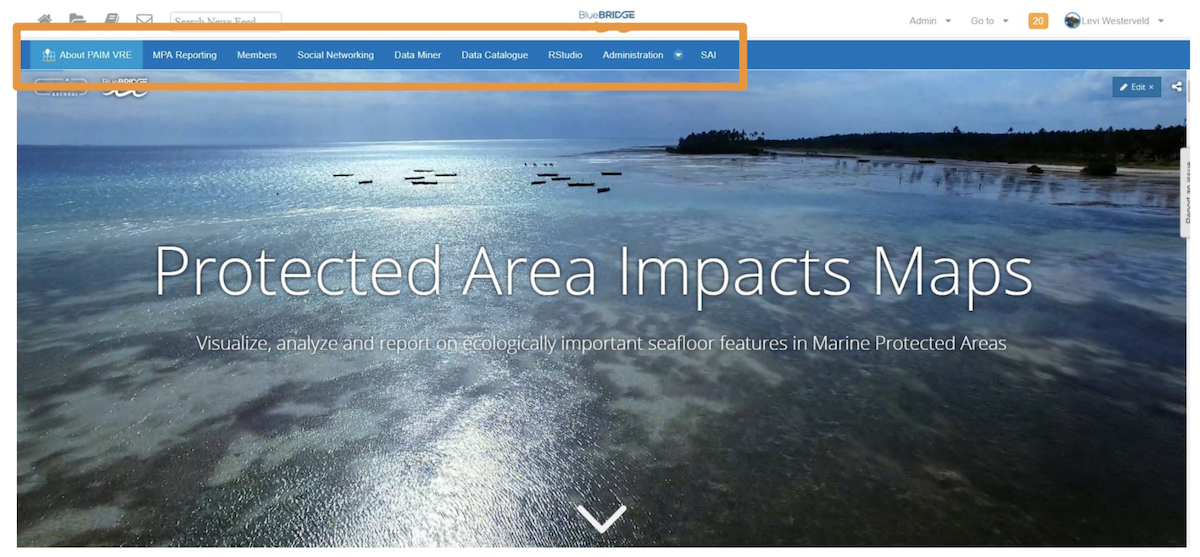
The second VRE concerned monitoring Maritime Protected Areas (MPA’s) using spatial data. Over 40% of our oceans show anthropogenic impact and countries are required to comply with the Convention on Biological Diversity, the Aichi targets. In this example, the task was to create a tool to examine seagrass and mangroves that had to be accessible, user-friendly and with fast analysis (i.e. seconds rather than days). The result was MPA Reporting which access data and services through the D4Science platform, using Data Miner (a built-in facility). The tool has a dedicated catalogue and uses WFS links to access actual resources. Repeatability of processing and results is built in.
In the discussion following the two VRE demos, it was noted that to be able to produce a paper which contains links to services and data is a major step forward and that D4Science has a huge infrastructure for handling geospatial data. One issue was how to create such VREs in the first place as archaeologists are not IT developers. It was agreed that a technical developer was needed to assemble available components and co-creation could be supported. It was proposed to keep things simple and to develop a procedure which identified who did what and to start with the requirements and some simple examples. The link between the ARIADNE Catalogue and a VRE can be seamless. All the issues raised affect the ARIADNEplus Pilots which will also use VREs and it was suggested that the VRE use cases and Pilots needed to get together to define their requirements. Some training for the archaeologists may be useful about the geospatial components in D4Science. The next workshop for VREs will focus on Environmental and Bio-archaeology and will be held in March.
*Coro G., Vilas L.G., Magliozzi C., et al. (2018): Forecasting the ongoing invasion of Lagocephalus sceleratus in the Mediterranean Sea. In: Ecological Modelling, 371, 37-49, https://doi.org/10.1016/j.ecolmodel.2018.01.007